
Untitled
2022-09-04
R Markdown
正态分布密度、分布图
x=seq(-5,5,0.1) plot(x,dnorm(x),type=”l”) #密度函数曲线 abline(v=2.5,col=2)

plot(x,pnorm(x),type=”l”) #分布函数曲线
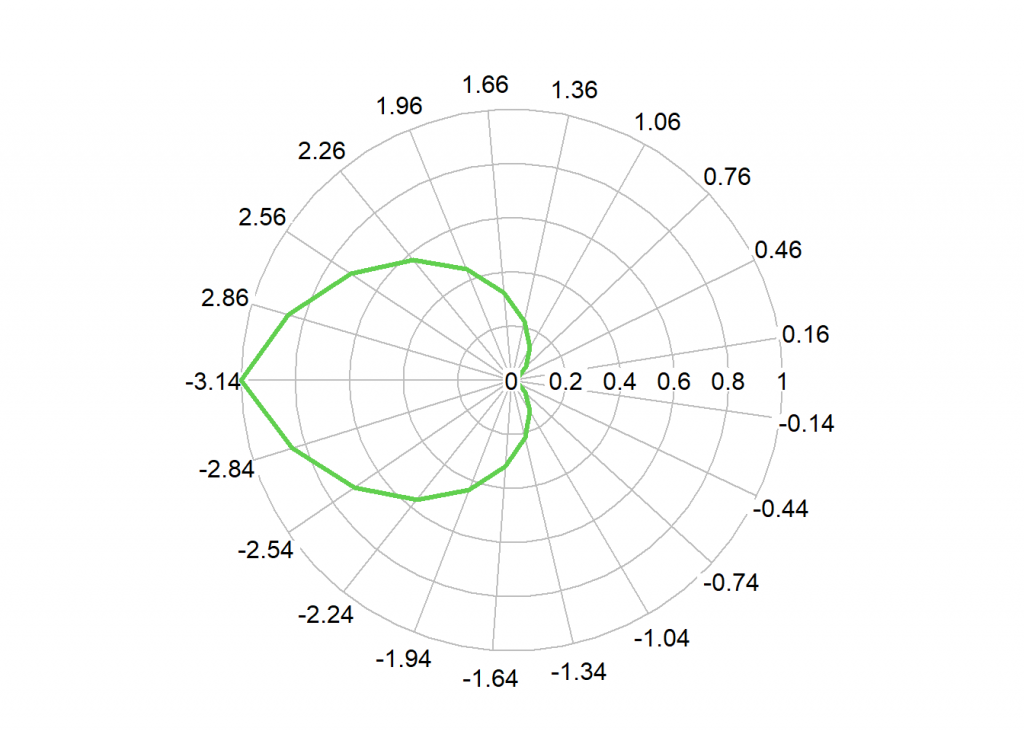
绘制极坐标
library(plotrix) t<-seq(-pi,pi,0.3) r<- 1-cos(t/2) radial.plot(r,t,rp.type=”p”,lwd=3,line.col=3)
This is an R Markdown document. Markdown is a simple formatting syntax for authoring HTML, PDF, and MS Word documents. For more details on using R Markdown see http://rmarkdown.rstudio.com.
When you click the Knit button a document will be generated that includes both content as well as the output of any embedded R code chunks within the document. You can embed an R code chunk like this:
summary(cars)
## speed dist ## Min. : 4.0 Min. : 2.00 ## 1st Qu.:12.0 1st Qu.: 26.00 ## Median :15.0 Median : 36.00 ## Mean :15.4 Mean : 42.98 ## 3rd Qu.:19.0 3rd Qu.: 56.00 ## Max. :25.0 Max. :120.00
Including Plots
You can also embed plots, for example:
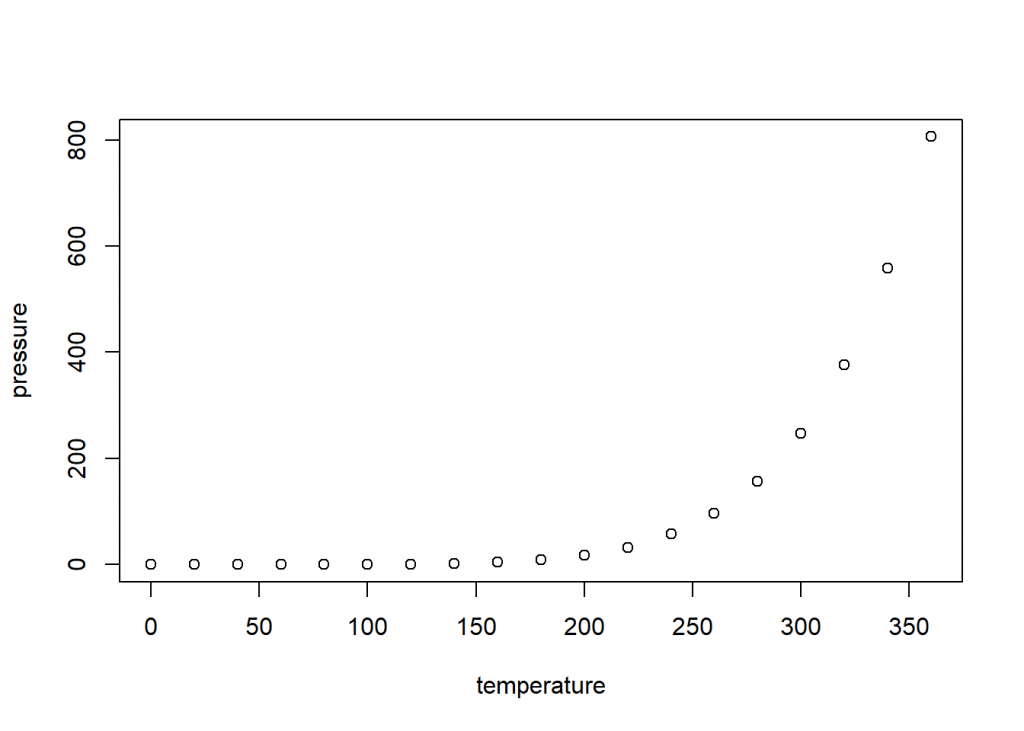
Note that the echo = FALSE parameter was added to the code chunk to prevent printing of the R code that generated the plot.